Environmental Performance
Climate Change and Sustainable Development
 Minimising Carbon Intensity and Adopting a Low Carbon Growth Path
") |
 |
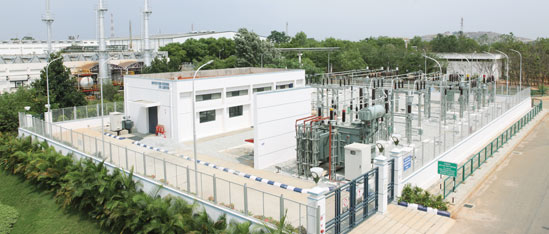
Sources of Energy
In 2011-12, ITC Units consumed 21,130 Terra Joules (TJ) of energy, which is 6.3% lower than the energy utilised in the previous year (22,554 TJ in 2010-11), in spite of significant growth in almost all businesses. This is attributed to the multitude of energy conservation projects implemented across ITC Units.
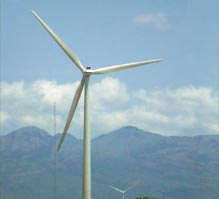
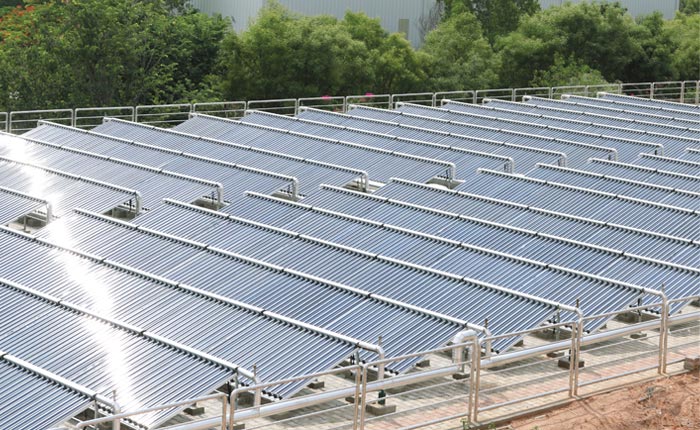
In 2011-12, 8133.3 TJ of the total energy consumed was from renewable sources which is an increase of 2.2% over the previous year (7957.2 TJ in 2010-11). Improved utilisation of carbon neutral fuels such as biofuels in the Paperboards and Specialty Papers Business and the commissioning of 13.8 MW wind power projects in Maharashtra and Tamil Nadu, contributed to increased utilisation of renewable energy, even though the renewable energy contribution from the above wind power projects has only been for part of the year.