ITC Sustainability Report 2007
Chairman’s Statement:
ITC’s Vision and Strategy
ITC:
Organisational Profile
Certifications, Honours & Awards Report
Parameters
Governance, Commitments & Engagements
ITC’s Triple Bottom Line GRI Index Statement from PricewaterhouseCoopers Annexures Self-declaration on Application Level
«»

ECONOMIC PERFORMANCE


Direct Economic Impact

(Rs. Crores)
Key Economic Indicators 2005 2006 2007
Gross Turnover 13349 16224 19315
Net Turnover 7639 9790 12179
       
       
Exports 1009 1413 1926
Taxes Paid/Contribution to Exchequer 6523 7677 8455
Cost of Goods 2770 3983 5195
Consumption of Raw Materials & Stores and Spares 2142 2823 3586
Payroll Expenses 467 541 630
Interest paid on Debts & Borrowings 42 12 3
Dividend Paid (including Tax on Dividend) 882 1135 1365
Retained Profits 1310 1101 1335
Community Investments 56 65 64
* Detailed Financial performance available at www.itcportal.com


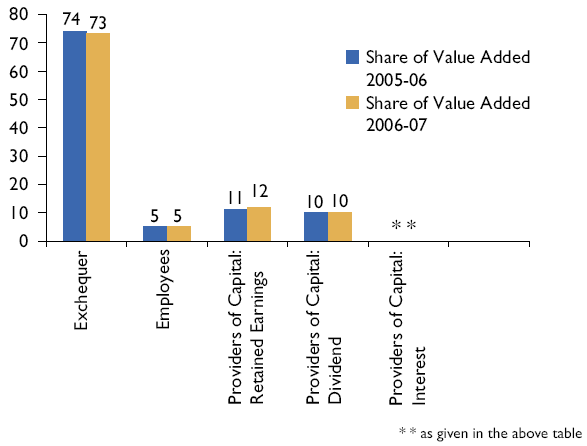
Analysis of Value-Added

   (Percentage)
 
 
Image of Graph showing Analysis of Value Added from the Financial Year 2005-06 to 2006-07
«»
Chairman’s Statement:
ITC’s Vision and Strategy
ITC:
Organisational Profile
Certifications, Honours & Awards Report
Parameters
Governance, Commitments & Engagements
ITC’s Triple Bottom Line GRI Index Statement from PricewaterhouseCoopers Annexures Self-declaration on Application Level
  
Sustainability Reports Archives
Sustainability Report 2013 | Sustainability Report 2012 | Sustainability Report 2011 | Sustainability Report 2010
Sustainability Report 2009 | Sustainability Report 2008 | Sustainability Report 2007 | Sustainability Report 2006
Sustainability Report 2005 | Sustainability Report 2004